


Latest News!
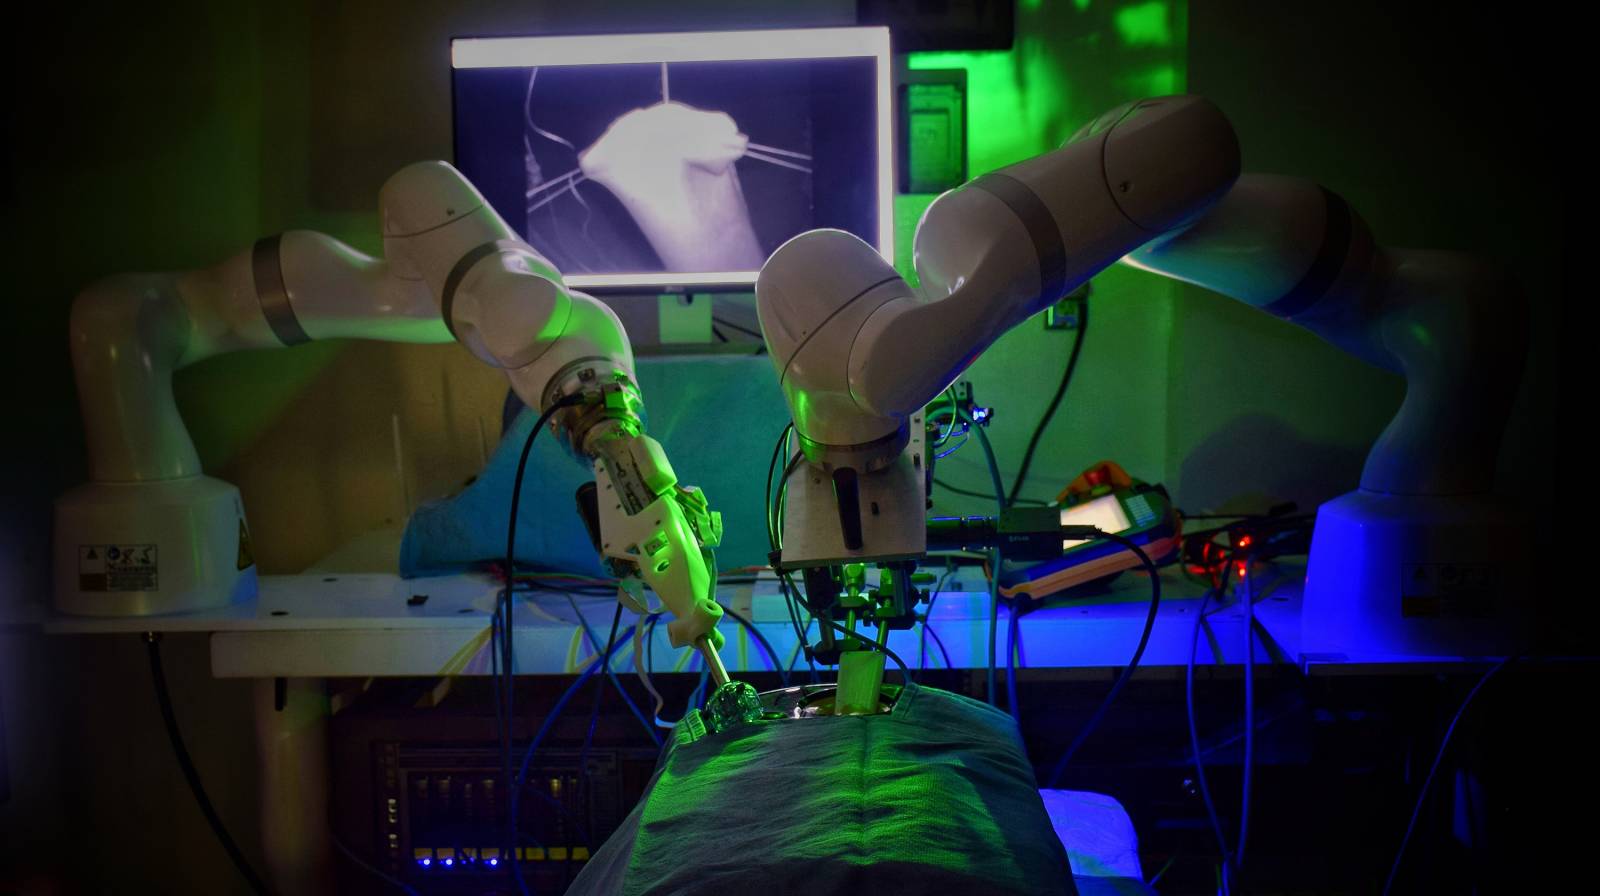
Robot performs first laparoscopic surgery without human help.
In four experiments on pig tissues, the robot excelled at suturing two ends of intestine—one of the most intricate and delicate tasks in abdominal surgery. read more.
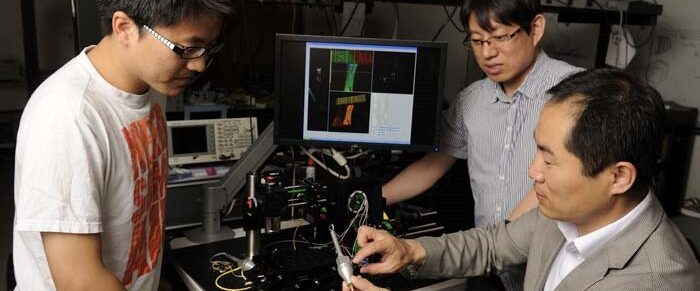
About our lab
The Photonics and Optoelectronics Laboratory at the Department of Electrical and Computer Engineering in the Johns Hopkins University conducts experimental and theoretical investigations in the area of photonics and optoelectronics with an emphasis on developing:
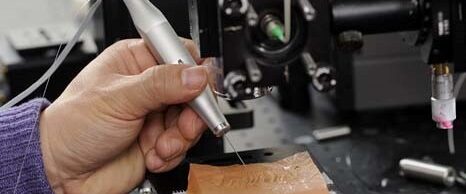
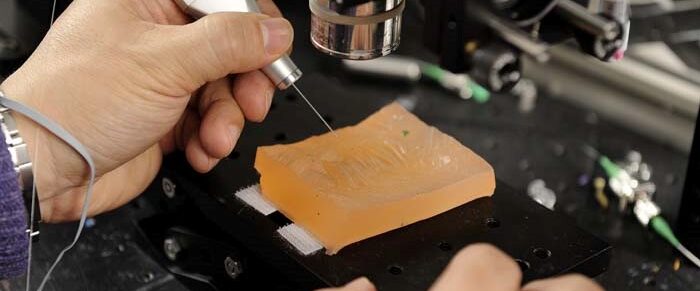
• Novel fiber optic imaging and sensor systems
• Fiber optic devices for medical applications
• Ultrafast fiber optic and optoelectronic devices
These developments have applications in the areas of medicine, communications, and the space sciences.
We work closely with the NASA, FDA, ARL, NIST, NRL as well as local industries and other research groups in and outside the Johns Hopkins University.